NEW Ezenics Graph Tool Deployed

Ezenics Graph Tool
Introducing the NEW Ezenics Graph Tool!
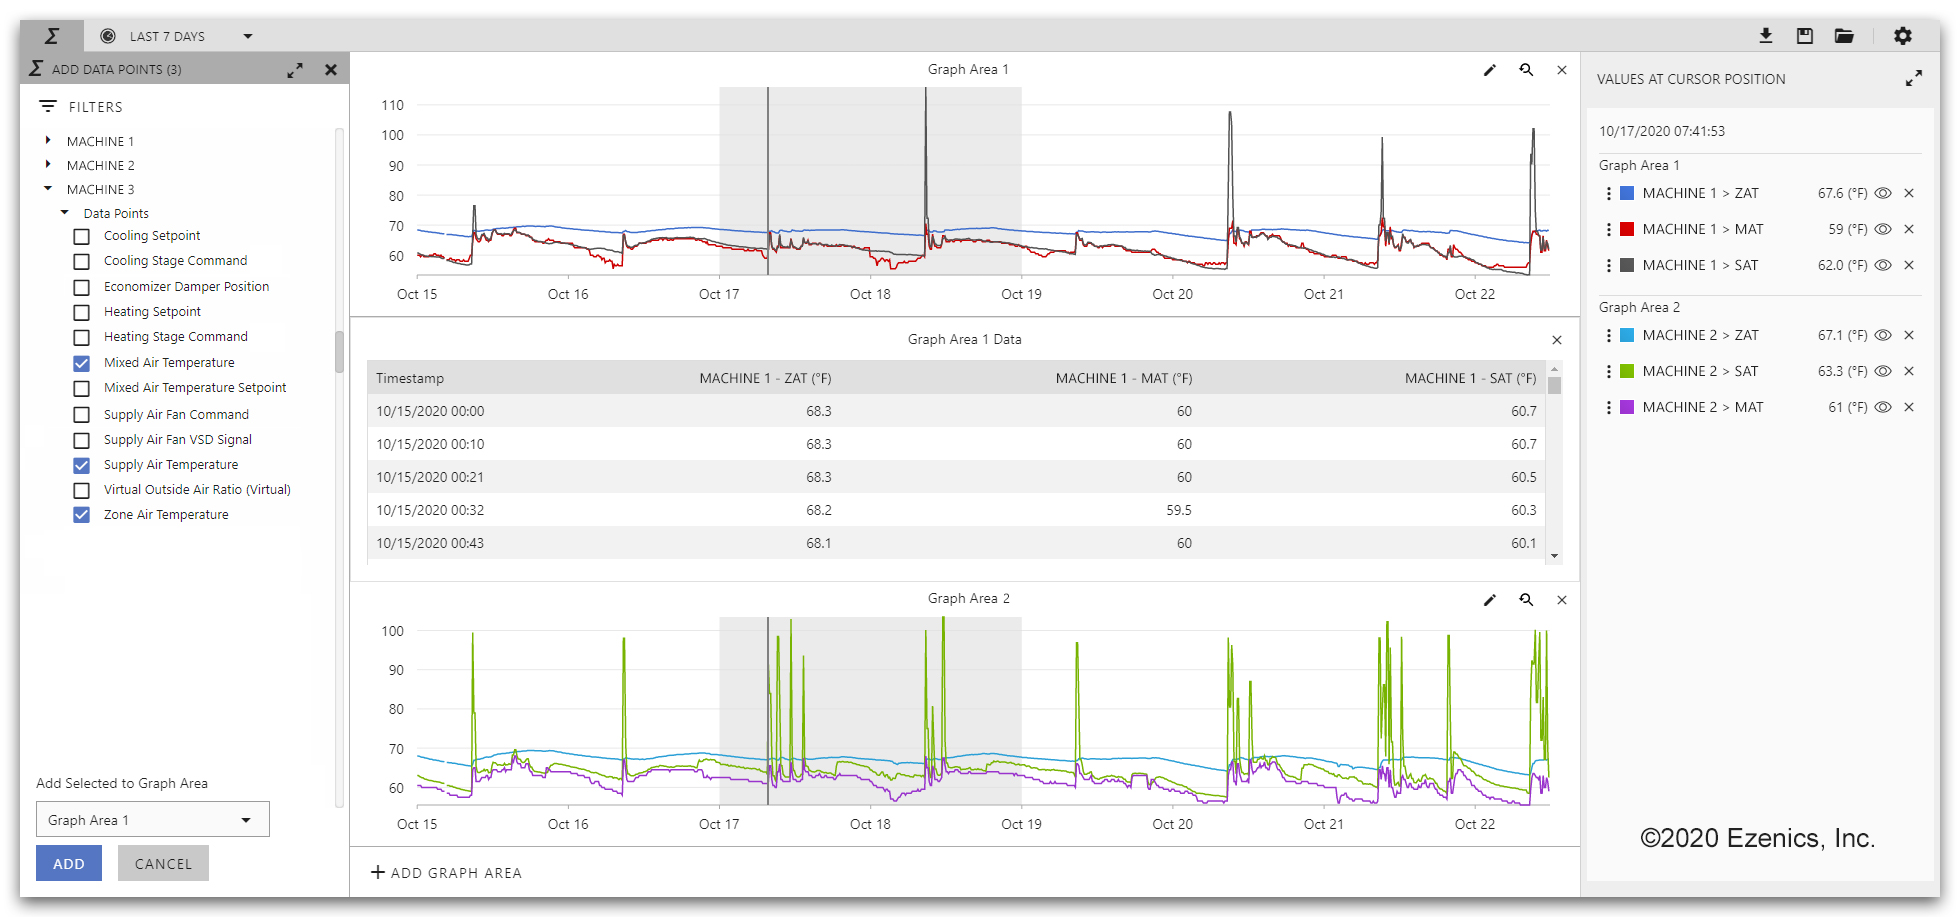
Whether you’re preparing a visualization for a weekly report, performing a detailed analysis of an issue involving multiple machines and many data points, or all you need is a quick trend of a specific point, the Ezenics Graph Tool has you covered. With its intuitive, customizable interface and all of the great new features, filters, and high-performance optimizations, visualizing and exporting your data has never been easier.
Visualize and Export Your Data
- Graph any data point(s) in the Ezenics platform, including physical and calculated data points or diagnostic detections over any time range.
- Analyze and compare data points across multiple machines and locations.
- Perform fast, in-depth investigation of equipment issues.
New Features and Benefits
- Filter, select, and add multiple data points simultaneously to any Graph Area.
- Set Dynamic Time Ranges, such as “Last 24 Hours” or “Last 7 Days”.
- Customize the Workspace layout and individual Graph Area sizes to make them stand out.
- Display raw data values within the Workspace with Table Areas.
- Zoom and pan with improved controls and previews.
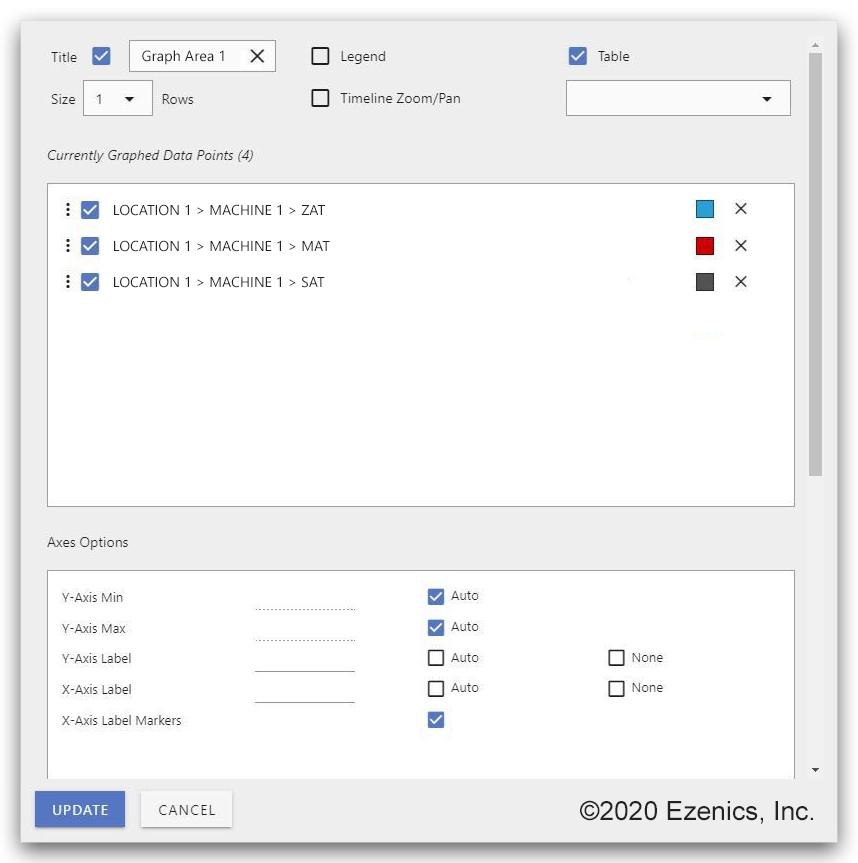
- Flexibly configure individual Graph Areas with titles, axis scales, labels, legends, colors, and more using the new Graph Area Editor.
- View on more devices and display sizes with the responsive UI.
- Enjoy peace of mind with enhanced security and cross-browser HTML5 framework.
The Ezenics team will continue to release more features and functionalities for the new Graph Tool over the coming months. Connect with us on LinkedIn or Twitter for future updates, or schedule a demo with the Ezenics team to learn more!

Graph Area Editor